Adelaide Hills Council Pollen Forecast - Today, Tomorrow and the Week Ahead
Pollen Today
Today (15 October) pollen in Adelaide Hills Council is high; cypress, eucalyptus, and grass are high; acacia and mold (cladosporium) are moderate; mold (alternaria) is low.
Pollen Tomorrow
Tomorrow (16 October 2026) acacia remains moderate, cypress remains high, eucalyptus remains high, mold (cladosporium) remains moderate, grass declining, mold (alternaria) increasing.
7-Day Trend
Over the next week eucalyptus and grass will increase; acacia, cypress, mold (alternaria), and mold (cladosporium) will decrease.
Explore Forecasts
Air Quality & Mold
Pollen for Neighborhoods
Pollen & AQ for Routes
Get More in Our App
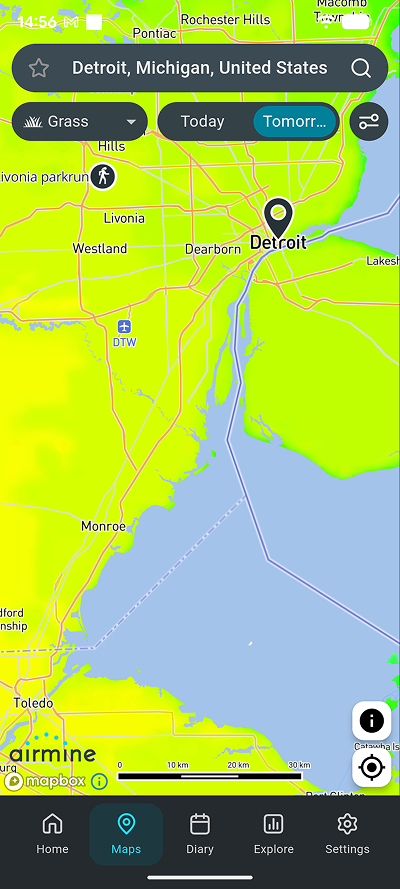
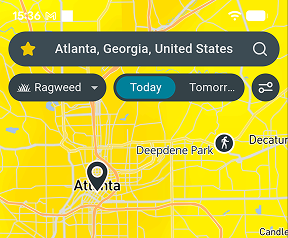
Local pollen and air quality forecasts, interactive pollen maps and route profiles


Features and forecast availability vary by region.
Pollen Risk
Today - 15 October
| Pollen species | Level | Value |
|---|---|---|
| Acacia (Acacia) | Moderate | 49/100 |
| Cypress (Cupressaceae) | High | 68/100 |
| Eucalyptus (Myrtaceae) | High | 71/100 |
| Grass (Poaceae) | High | 54/100 |
| Mold (Alternaria) | Low | 25/100 |
| Mold (Cladosporium) | Moderate | 41/100 |
Tomorrow - 16 October
| Pollen species | Level | Value | 7-Day Trend |
|---|---|---|---|
| Acacia (Acacia) | Moderate | 41/100 | |
| Cypress (Cupressaceae) | High | 59/100 | |
| Eucalyptus (Myrtaceae) | High | 70/100 | |
| Grass (Poaceae) | Moderate | 47/100 | |
| Mold (Alternaria) | Moderate | 27/100 | |
| Mold (Cladosporium) | Moderate | 41/100 |
Local Environmental Conditions
The heart of Adelaide Hills Council is surrounded mainly by woodland, which covers around 54% of the nearby area, with a good deal of open grassland. Trees are an important local pollen source, given how much woodland surrounds the area. Grasses and weeds such as plantain and pigweed round out the local mix.
Flowering trees bring the first pollen of the year in early spring. Grass pollen follows, peaking in late spring and easing off by early fall. Plantain and pigweed flower through much of the warmer half of the year. Winter is the wettest time of year, and heavy showers can bring short breaks in pollen.
Get pollen & AQ on Strava
Follow your environmental exposure and performance with the free Airmine-Strava integration. See your pollen and air quality exposure for every Strava activity.
Resource Hub
Pollen forecast neighborhoods 15 neighborhoods
Local parkruns 31 parkruns
Frequently Asked Questions About Pollen in South Australia
Is pollen high in Adelaide Hills Council right now?
On 15 October 2026, overall pollen levels in Adelaide Hills Council are high. Eucalyptus is the main contributor to airborne pollen, while grass, cypress, and acacia remain at lower levels
Will pollen levels change in Adelaide Hills Council tomorrow?
On 16 October 2026, pollen conditions in Adelaide Hills Council will be different from today, with acacia at moderate levels, eucalyptus at high levels, cypress at high levels and grass continuing to decline
Is pollen expected to decrease in Adelaide Hills Council this week?
According to the five-day outlook, acacia and cypress pollen levels are expected to gradually decrease, while eucalyptus and grass pollen will increase, suggesting mixed conditions later in the week.
Which pollen types are currently active in Adelaide Hills Council?
On 15 October 2026, Eucalyptus is the dominant pollen source in Adelaide Hills Council. grass, cypress, and acacia are also present but at lower levels.
When is pollen season in Adelaide Hills Council?
How often is the Adelaide Hills Council pollen forecast updated?
The Adelaide Hills Council pollen forecast is updated four times daily. See the timestamp below for the most recent update.
Does pollen in Adelaide Hills Council come from nearby or far away?
Studies show that most pollen exposure (often 70–90%) comes from nearby sources, such as local trees and vegetation. A good pollen forecast therefore depends on accurately representing local vegetation. Pollen can travel long distances, but this usually matters only early in the season or during specific wind events.
Are pollen levels in Adelaide Hills Council based on measurements or forecasts?
Pollen data is often misunderstood. Most "pollen levels" are not real-time measurements, but forecasts.
Direct pollen measurements are typically delayed by 1-2 days because they require manual analysis. To show current conditions in Adelaide Hills Council, modern forecasts combine recent measurements, weather data, and information about local vegetation.
This allows us to estimate pollen levels for today and the coming days, not just report the past.
Airmine’s atmospheric monitoring platform was developed with support from the European Space Agency (ESA)’s Business Applications and Space Solutions (BASS) team, using satellite and Earth observation technologies to improve emissions monitoring.
Understanding the Scale
The 0–100 pollen scores represent risk levels, not direct pollen measurements. Higher scores indicate higher risk.
Pollen
| None | 0 | No or negligible risk of exposure. Pollen/mold exposure is expected to be minimal. |
| Low | 0-25 | Low risk of exposure. Small amounts of pollen or mold spores may be present. |
| Moderate | 25-50 | Moderate risk of exposure. Pollen/mold exposure is expected to be noticeable. |
| High | 50-75 | High risk of exposure. Elevated pollen/mold exposure is expected. |
| Very High | 75-100 | Very high risk of exposure. Pollen/mold exposure is expected to be at or near its highest levels. |
Get More in the Airmine Pollen app
Get 15-day pollen forecasts with morning, afternoon and evening detail, plus 5-day air quality forecasts. Explore interactive pollen risk maps, estimated pollen season start, route profiles and a symptoms diary.
Features and forecast availability vary by region. Currently covering Europe, the contiguous US, southern Canada, South Africa, Australia, Indonesia (Java & Bali), Brazil, Paraguay, Uruguay and the Buenos Aires area.
Developed with support from the European Space Agency (ESA) Business Applications and Space Solutions (BASS).