Our pollen model
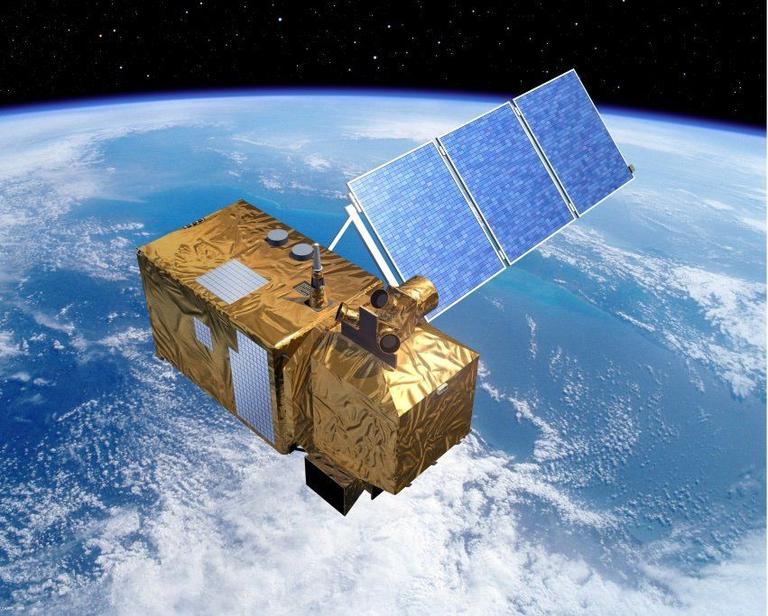
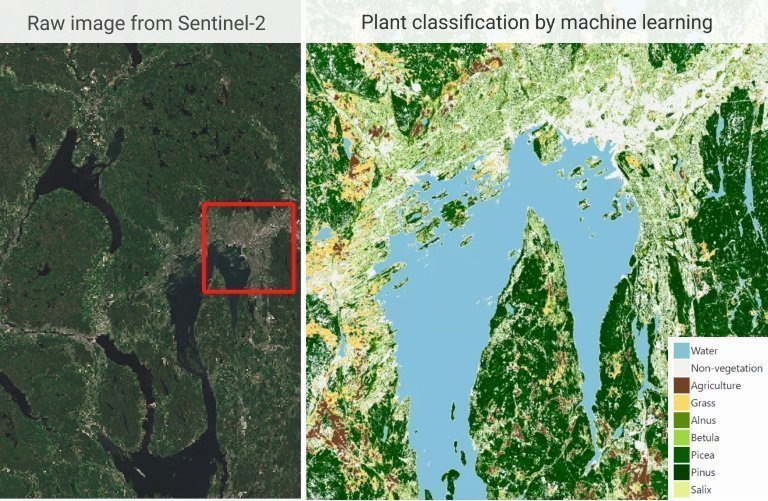
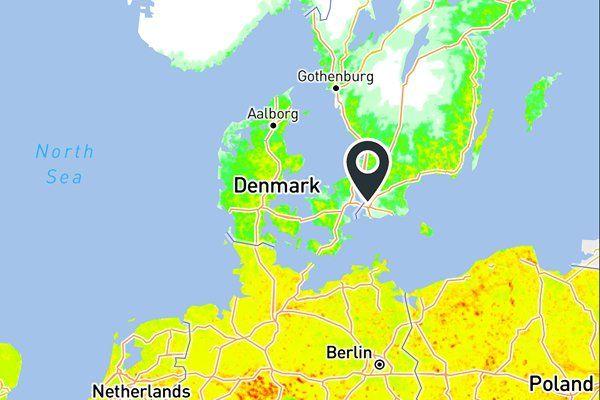
Powered by satellite observations, weather forecasts, and machine learning, our proprietary model estimates pollen risk at local and regional scales.
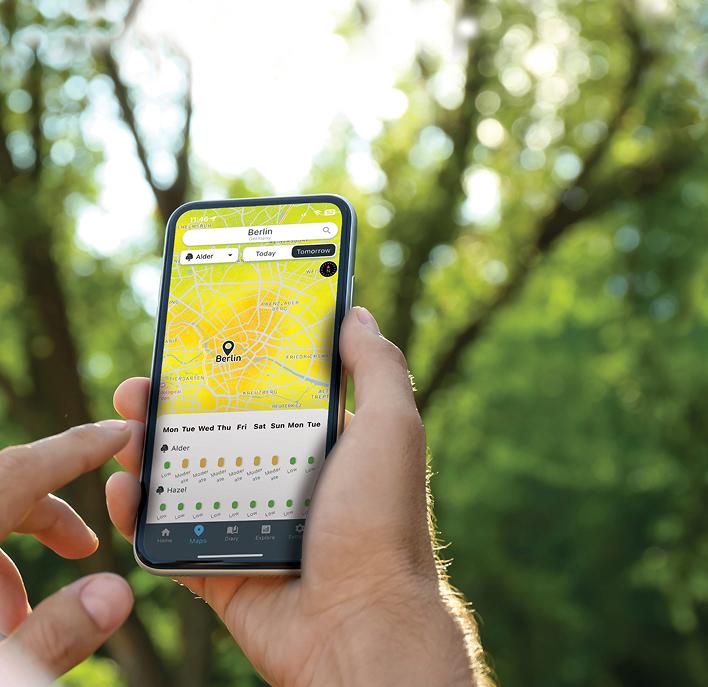
Simply put, we combine data from multiple sources, process it in real time, and turn it into actionable pollen forecasts that help people plan ahead and better manage their allergies.