Bourke Street Mall, Melbourne Air Quality Forecast - Today, Tomorrow

Air Quality Today

Fair 33/100

Today (7 October): Air quality in Bourke Street Mall is fair. AQI, PM2.5, PM10, and NO2 are fair; O3, SO2, CO, HCHO, and PM1 are good. Pollution peaks around 8:00 AM (PM2.5: 32.6/100).

Air Quality Tomorrow

Fair 39/100

Tomorrow (8 October 2026): Air quality in Bourke Street Mall is fair. All pollutants stay as today. Pollution peaks around 9:00 AM (PM2.5: 38.9/100).

Updated: 7 October 2026 at 03:07 CEST

Explore Forecasts

Air Quality Forecast for Neighborhoods

94 neighborhoods in Melbourne

Abbotsford AQI today AQI tomorrow AC/DC Lane AQI today AQI tomorrow ACMI AQI today AQI tomorrow Albert Park AQI today AQI tomorrow ANZ Banking Museum AQI today AQI tomorrow Batman's Hill AQI today AQI tomorrow Block Arcade AQI today AQI tomorrow Bourke Street Mall AQI today AQI tomorrow Box Hill AQI today AQI tomorrow Brighton AQI today AQI tomorrow Brunswick AQI today AQI tomorrow Camberwell AQI today AQI tomorrow Carlton AQI today AQI tomorrow Carlton North AQI today AQI tomorrow Caulfield AQI today AQI tomorrow Cenotaph AQI today AQI tomorrow Centre Place AQI today AQI tomorrow Century Building AQI today AQI tomorrow Chinatown AQI today AQI tomorrow Chinese Museum AQI today AQI tomorrow Coburg AQI today AQI tomorrow Collingwood AQI today AQI tomorrow Coop's Shot Tower AQI today AQI tomorrow Degraves Street AQI today AQI tomorrow Docklands AQI today AQI tomorrow East End Theatre District AQI today AQI tomorrow East Melbourne AQI today AQI tomorrow Eight Hour Monument AQI today AQI tomorrow Elwood AQI today AQI tomorrow Essendon AQI today AQI tomorrow Evan Walker Bridge Lookout AQI today AQI tomorrow Federation Square AQI today AQI tomorrow Federation Wharf AQI today AQI tomorrow Fishermans Bend AQI today AQI tomorrow Fitzroy AQI today AQI tomorrow Fitzroy North AQI today AQI tomorrow Floral Clock AQI today AQI tomorrow Footscray AQI today AQI tomorrow Frankston Beach AQI today AQI tomorrow Geoffrey Kaye Museum of Anaesthetic History AQI today AQI tomorrow Greek Precinct AQI today AQI tomorrow Hawthorn AQI today AQI tomorrow Hellenic Museum AQI today AQI tomorrow Ian Potter Centre: NGV Australia AQI today AQI tomorrow Immigration Museum AQI today AQI tomorrow John Batman Memorial AQI today AQI tomorrow Jolimont AQI today AQI tomorrow Kensington AQI today AQI tomorrow Kew AQI today AQI tomorrow Koorie Heritage Trust AQI today AQI tomorrow Koreatown AQI today AQI tomorrow La Trobe Reading Room AQI today AQI tomorrow Levy and Robinson's Warehouse AQI today AQI tomorrow Malvern AQI today AQI tomorrow Marquis of Linlithgow AQI today AQI tomorrow Melbourne AQI today AQI tomorrow Moonee Ponds AQI today AQI tomorrow North Melbourne AQI today AQI tomorrow Northcote AQI today AQI tomorrow Old Melbourne Gaol AQI today AQI tomorrow Parkville AQI today AQI tomorrow Pellegrini's AQI today AQI tomorrow Piano AQI today AQI tomorrow Port Melbourne AQI today AQI tomorrow Prahran AQI today AQI tomorrow Preston AQI today AQI tomorrow Princess Theatre AQI today AQI tomorrow Queen Victoria Market AQI today AQI tomorrow Richmond AQI today AQI tomorrow Russell's Old Corner Shop AQI today AQI tomorrow Shot Tower Museum AQI today AQI tomorrow Shrine of Remembrance AQI today AQI tomorrow Shrine of Remembrance Education Centre AQI today AQI tomorrow South African War Memorial AQI today AQI tomorrow South Melbourne AQI today AQI tomorrow South Wharf AQI today AQI tomorrow South Yarra AQI today AQI tomorrow Southbank AQI today AQI tomorrow St Albans AQI today AQI tomorrow St Kilda AQI today AQI tomorrow Standing by Tunnerminnerwait and Maulboyheenner AQI today AQI tomorrow Stone of Remembrance AQI today AQI tomorrow Street Art AQI today AQI tomorrow Sunshine AQI today AQI tomorrow The Big Clock AQI today AQI tomorrow Toorak AQI today AQI tomorrow Victoria Harbour AQI today AQI tomorrow Werribee AQI today AQI tomorrow West Melbourne AQI today AQI tomorrow William Barak Bridge AQI today AQI tomorrow Williamstown AQI today AQI tomorrow Windsor AQI today AQI tomorrow Yarra’s Edge AQI today AQI tomorrow Yarraville AQI today AQI tomorrow

Get More in Our App

Local pollen and air quality forecasts, interactive pollen maps and route profiles

Download on the App Store Get it on Google Play

Features and forecast availability vary by region.
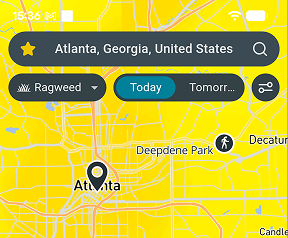
Airmine app pollen map

Air Quality

Today - 7 October

Pollen species Level Value
AQI
Fair
32.6/100
PM2.5 (fine particles)
Fair
32.6/100
PM10 (coarse particles)
Fair
22.3/100
NO2 (nitrogen dioxide)
Fair
28.7/100
O3 (ozone)
Good
9.0/100
SO2 (sulfur dioxide)
Good
4.5/100
CO (carbon monoxide)
Good
0.4/100
HCHO (formaldehyde)
Good
3.8/100
PM1 (ultrafine particles)
Good
7.0/100

Tomorrow - 8 October

Pollen species Level Value
AQI
Fair
38.9/100
PM2.5 (fine particles)
Fair
38.9/100
PM10 (coarse particles)
Fair
20.8/100
NO2 (nitrogen dioxide)
Fair
33.7/100
O3 (ozone)
Good
11.0/100
SO2 (sulfur dioxide)
Good
5.0/100
CO (carbon monoxide)
Good
0.6/100
HCHO (formaldehyde)
Good
4.8/100
PM1 (ultrafine particles)
Good
12.7/100
ENVIRONMENT & ANALYSIS

Local Environmental Conditions

With buildings covering much of the area around this site in Melbourne, traffic and other urban emissions are the biggest local influence on air quality. Pockets of trees and green space help filter a small share of the particles from traffic. Winds here are fairly strong, averaging around 15 km/h, which helps disperse local pollution. Pollution carried in from the wider region can also raise levels at times.

From June to August, temperatures near 9°C let smoke and particles from home heating and traffic build up, especially on cold, still mornings. Summer sun in January cooks traffic fumes into ozone, especially in the warmest month, which averages 20°C. September is usually the windiest month, averaging about 20 km/h, which helps keep the air clean.

Get pollen & AQ on Strava

Follow your environmental exposure and performance with the free Airmine-Strava integration. See your pollen and air quality exposure for every Strava activity.

Resource Hub

Pollen forecasts for Melbourne Mold forecasts for Melbourne
Air quality forecast neighborhoods 94 neighborhoods
Abbotsford
AQI today AQI tomorrow
AC/DC Lane
AQI today AQI tomorrow
ACMI
AQI today AQI tomorrow
Albert Park
AQI today AQI tomorrow
ANZ Banking Museum
AQI today AQI tomorrow
Sports venues in Melbourne 28 sports venues
AAMI Park
AQI today AQI tomorrow
Albert Park Public Golf Course
AQI today AQI tomorrow
Arden Street Oval
AQI today AQI tomorrow
Cape Schanck Resort Golf Course
AQI today AQI tomorrow
Ikon Park (Princes Park)
AQI today AQI tomorrow

Frequently Asked Questions About Air Quality in Victoria

Is air quality bad in Bourke Street Mall right now?

On 7 October 2026, overall air quality in Bourke Street Mall is fair. AQI is the main air quality indicator at 32.6/100. Pollution peaks around 8:00 AM (PM2.5: 32.6/100).

Will air quality be worse tomorrow in Bourke Street Mall?

On 8 October 2026, air quality conditions in Bourke Street Mall will be similar to today, with AQI forecast at fair at 38.9/100. Pollution peaks around 9:00 AM (PM2.5: 38.9/100).

When is air pollution at its worst in Bourke Street Mall?

From June to August, temperatures near 9°C let smoke and particles from home heating and traffic build up, especially on cold, still mornings. Summer sun in January cooks traffic fumes into ozone, especially in the warmest month, which averages 20°C. September is usually the windiest month, averaging about 20 km/h, which helps keep the air clean.

Are air quality levels in Bourke Street Mall based on measurements or forecasts?

It is forecasts derived by downscaling forecasts provided by EU’s Copernicus Atmosphere Monitoring Service (CAMS) by taking into account local conditions such as traffic patterns. CAMS bases its forecast on satellite measurements of particles and chemical compounds in the atmosphere. Airmine’s services were developed with support from the European Space Agency (ESA)’s Business Applications and Space Solutions (BASS) team.

Why doesn’t the forecast always reflect wildfire impacts?

Airmine’s forecast uses CAMS (Copernicus Atmosphere Monitoring Service) as its background atmospheric model. While CAMS includes wildfire emissions, these are derived from satellite observations and are not available in real time. During rapidly evolving wildfire events, there may therefore be a delay before increased emissions are incorporated into the model. As a result, the forecast may temporarily underestimate PM₂.₅ and other pollutants associated with wildfire smoke.

During rapidly evolving wildfire events, CAMS may lag by approximately 1–2 days before increased wildfire emissions are fully represented, which can lead to temporary underestimation of PM₂.₅ concentrations in Airmine’s forecast.

Understanding the Scale

The 0–100 air quality scores represent risk levels, not direct air pollutant concentrations. Higher scores indicate higher risk.

Air Quality

Good
0-20 Low air quality risk. Air quality is expected to be good, with low levels of pollution.
Fair
20-40 Generally low air quality risk. Air quality is expected to be acceptable, with some pollution present.
Moderate
40-60 Moderate air quality risk. Air pollution is elevated and air quality may be less favorable.
Poor
60-80 High air quality risk. Air pollution is high and air quality is expected to be poor.
Very Poor
80-100 Very high air quality risk. Air pollution is very high and air quality is expected to be very poor.

Airmine’s atmospheric monitoring platform was developed with support from the European Space Agency (ESA)’s Business Applications and Space Solutions (BASS) team, using satellite and Earth observation technologies to improve emissions monitoring. This page provides the latest public air quality forecast for Melbourne.

Data provided by Airmine — Last update: 7 October 2026 at 03:07 CEST (Data is updated four times daily.)

Methodology & Technology

Airmine combines satellite observations, weather forecasts and machine learning to forecast pollen, air quality and mold risk. For pollen, vegetation maps and weather data help predict season onset and exposure at 400 × 400 metre resolution. For air quality, we refine Copernicus CAMS forecasts using local factors such as roads, emissions and terrain. For routes, data is updated dynamically to provide accurate exposure metrics along the specific race corridor coordinates.

Our models are calibrated against millions of professional monitoring records and updated four times daily as new data becomes available.

Unless stated otherwise, this content is Airmine’s sole responsibility and has not been paid for by external organisations.

Disclaimer

The information provided is for environmental awareness only and does not constitute medical advice. Athletes with known respiratory conditions or severe allergies should consult their physician before participating in strenuous outdoor activities based on these forecasts.

Some text on this page may be generated or summarised using artificial intelligence (AI). Wherever possible, AI-generated content is enriched with Airmine's proprietary data to improve its accuracy and relevance. However, AI-generated content may still contain errors, omissions, or inaccuracies.