Cambridge Mold Forecast - Today, Tomorrow and the Week Ahead
Mold Today
Today (11 October) mold in Cambridge is low; alternaria and cladosporium are low.
Mold Tomorrow
Tomorrow (12 October 2026) levels are similar to today.
7-Day Trend
Over the next week alternaria and cladosporium will increase.
Explore Forecasts
Pollen & Air Quality
Mold in Other Cities
Pollen & AQ for Routes
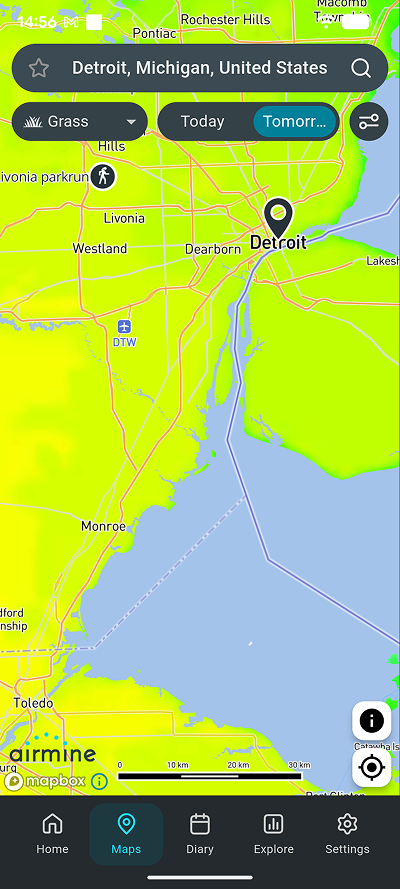
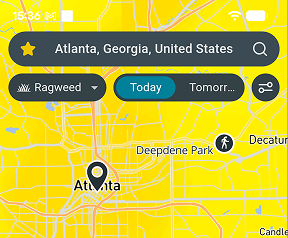
Get More in Our App
Local pollen and air quality forecasts, interactive pollen maps and route profiles


Features and forecast availability vary by region.
Mold Risk
Today - 11 October
| Mold species | Level | Value |
|---|---|---|
| Alternaria | Low | 7/100 |
| Cladosporium | Low | 17/100 |
Tomorrow - 12 October
| Mold species | Level | Value | 7-Day Trend |
|---|---|---|---|
| Alternaria | Low | 4/100 | Steady |
| Cladosporium | Low | 12/100 | Steady |
Local Mold Conditions
Organic material for mold is moderately available around the heart of Cambridge, mostly in the green spaces among the buildings and the woodland. Among the buildings, gardens, parks and street trees supply compost, mulch and fallen leaves in smaller pockets. Patches of woodland add fallen maple and ash leaves, bark and decaying wood, which hold moisture and support mold growth.
From April to October, Cladosporium, the most common outdoor mold, is active on the woodland litter, with counts topping out in July at about 18°C. Alternaria needs more warmth and is most abundant in July. In January, temperatures below 5°C keep both molds at very low levels. Day to day, spores peak on dry, breezy afternoons after dew or light rain.
Get pollen & AQ on Strava
Follow your environmental exposure and performance with the free Airmine-Strava integration. See your pollen and air quality exposure for every Strava activity.
Resource Hub
Mold forecast neighborhoods 1 neighborhood
Local parkruns 29 parkruns
Local events 1 event
Frequently Asked Questions About Mold in Cambridgeshire
Why do I still have allergy symptoms after the pollen season?
Allergy symptoms after the main pollen season may be caused by mold spores. Outdoor mold levels can remain high into late summer and autumn, when pollen levels are already falling. Mold allergy can cause symptoms similar to pollen allergy, including sneezing, a runny or blocked nose, itchy eyes, coughing, and wheezing.
What are mold spores and why do they cause allergies?
Mold spores are tiny particles released by fungi into the air. When inhaled, they can trigger an allergic reaction in sensitive people. Common symptoms include sneezing, a runny or blocked nose, itchy or watery eyes, coughing, and wheezing.
When are mold spore levels highest?
Outdoor mold spore levels often increase during warm and humid conditions, particularly when there is plenty of decaying vegetation. Levels can vary considerably with weather, season, vegetation, and location, and some types of mold are more common during particular times of the year, e.g. in the Fall.
How can I reduce my exposure to mold spores?
If you are sensitive to mold, check local mold spore levels and forecasts before spending long periods outdoors. On high-risk days, reducing time around dense vegetation, compost, fallen leaves, and other sources of decaying plant material may help limit exposure.
Understanding the Scale
The 0–100 mold scores represent risk levels, not direct mold measurements. Higher scores indicate higher risk.
Mold
| None | 0 | No or negligible risk of exposure. Pollen/mold exposure is expected to be minimal. |
| Low | 0-25 | Low risk of exposure. Small amounts of pollen or mold spores may be present. |
| Moderate | 25-50 | Moderate risk of exposure. Pollen/mold exposure is expected to be noticeable. |
| High | 50-75 | High risk of exposure. Elevated pollen/mold exposure is expected. |
| Very High | 75-100 | Very high risk of exposure. Pollen/mold exposure is expected to be at or near its highest levels. |
Get More in the Airmine Pollen app
Get 15-day pollen forecasts with morning, afternoon and evening detail, plus 5-day air quality forecasts. Explore interactive pollen risk maps, estimated pollen season start, route profiles and a symptoms diary.
Features and forecast availability vary by region. Currently covering Europe, the contiguous US, southern Canada, South Africa, Australia, Indonesia (Java & Bali), Brazil, Paraguay, Uruguay and the Buenos Aires area.
Developed with support from the European Space Agency (ESA) Business Applications and Space Solutions (BASS).