Meandering Lane, Tallahassee Air Quality Forecast - Today, Tomorrow

Air Quality Today

Moderate 47/100

Today (10 October): Air quality in Meandering Lane is moderate. AQI and PM10 are moderate; PM2.5 is fair; NO2, O3, SO2, CO, HCHO, and PM1 are good. Pollution peaks around 8:00 PM (PM10: 47.1/100).

Air Quality Tomorrow

Moderate 40/100

Tomorrow (11 October 2026): Air quality in Meandering Lane is moderate. All pollutants stay as today. Pollution peaks around 2:00 AM (PM10: 40.2/100).

Updated: 11 October 2026 at 03:11 CEST
Country: United States

Explore Forecasts

Air Quality Forecast for Neighborhoods

73 neighborhoods in Tallahassee

Alfred B. Maclay Gardens State Park AQI today AQI tomorrow All Saints AQI today AQI tomorrow Anita Davis Preserve at Henrietta Lake Park AQI today AQI tomorrow Avalon at Maclay AQI today AQI tomorrow B.Calvin Jones Center for Archaeology AQI today AQI tomorrow Bellevue Plantation House AQI today AQI tomorrow Bethlehem Missionary Baptist Church AQI today AQI tomorrow Betton Oaks AQI today AQI tomorrow Big Oak RV Park AQI today AQI tomorrow Blockhouse AQI today AQI tomorrow Bobbin Brook AQI today AQI tomorrow Bobbin Trace AQI today AQI tomorrow Camelot II Neighborhood AQI today AQI tomorrow Canopy AQI today AQI tomorrow Chief's House Footprint AQI today AQI tomorrow Cogswell House AQI today AQI tomorrow College Town AQI today AQI tomorrow Community Spirit AQI today AQI tomorrow Concord Schoolhouse AQI today AQI tomorrow De Soto Winter Encampment Site AQI today AQI tomorrow Eastgate AQI today AQI tomorrow Emerald Chase AQI today AQI tomorrow Enduring Spirit AQI today AQI tomorrow Family + Home Spirit AQI today AQI tomorrow Florida Historic Capitol Museum AQI today AQI tomorrow Florida Korean War Veteran's Memorial AQI today AQI tomorrow Florida State Capitol AQI today AQI tomorrow Florida Vietnam War Veteran's Memorial AQI today AQI tomorrow Four Corners of History Exhibit AQI today AQI tomorrow Francisco "Frank" Arroyo AQI today AQI tomorrow FSU Museum of Fine Arts AQI today AQI tomorrow Garage Apartment AQI today AQI tomorrow Goodwood Museum and Gardens AQI today AQI tomorrow Greene-Lewis House AQI today AQI tomorrow Hawk's Landing AQI today AQI tomorrow In Memory of Carolyn I. Steele AQI today AQI tomorrow Indian Mound AQI today AQI tomorrow Integration Statue AQI today AQI tomorrow John G. Riley House AQI today AQI tomorrow Knott House Museum AQI today AQI tomorrow L Kirk Edwards State Wildlife and Environment Area AQI today AQI tomorrow Lancy Amelie Gray AQI today AQI tomorrow Leon County's American Revolutionary War Soldiers AQI today AQI tomorrow Lincoln Plaque AQI today AQI tomorrow Los Robles AQI today AQI tomorrow Lynching Historical Marker AQI today AQI tomorrow Meandering Lane AQI today AQI tomorrow Meeting Street AQI today AQI tomorrow Messer House AQI today AQI tomorrow Miccosukee Land Coop AQI today AQI tomorrow Miccosukee Pines AQI today AQI tomorrow Mission San Luis AQI today AQI tomorrow Mission San Miguel AQI today AQI tomorrow Moore Pond AQI today AQI tomorrow Mrs. Glenn Terrell Plaque AQI today AQI tomorrow Ox Bottom Crest AQI today AQI tomorrow Park Charleston AQI today AQI tomorrow Park Dedication Plaque AQI today AQI tomorrow Park Founding Memorial AQI today AQI tomorrow Pilckem Ridge AQI today AQI tomorrow R.A. Gray Florida History Museum AQI today AQI tomorrow San Luis Mission Museum AQI today AQI tomorrow Small Park Dedication AQI today AQI tomorrow Smokey Hollow Barber Shop AQI today AQI tomorrow Smokey Hollow Historic Site AQI today AQI tomorrow Southwood AQI today AQI tomorrow Tallahassee Automobile Museum AQI today AQI tomorrow Tallahassee Civil Rights Memorial AQI today AQI tomorrow Tallahassee Museum AQI today AQI tomorrow Tallahassee RV Park AQI today AQI tomorrow Tallahassee's May Oak AQI today AQI tomorrow The Grove Museum AQI today AQI tomorrow The Union Bank AQI today AQI tomorrow

Get More in Our App

Local pollen and air quality forecasts, interactive pollen maps and route profiles

Download on the App Store Get it on Google Play

Features and forecast availability vary by region.
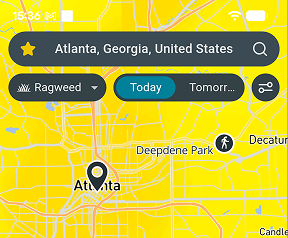
Airmine app pollen map

Air Quality

Today - 10 October

Pollutant Level Value
AQI
Moderate
47.1/100
PM2.5 (fine particles)
Fair
28.0/100
PM10 (coarse particles)
Moderate
47.1/100
NO2 (nitrogen dioxide)
Good
0.2/100
O3 (ozone)
Good
7.8/100
SO2 (sulfur dioxide)
Good
0.1/100
CO (carbon monoxide)
Good
0.4/100
HCHO (formaldehyde)
Good
0.8/100
PM1 (ultrafine particles)
Good
1.4/100

Tomorrow - 11 October

Pollutant Level Value
AQI
Moderate
40.2/100
PM2.5 (fine particles)
Fair
26.7/100
PM10 (coarse particles)
Moderate
40.2/100
NO2 (nitrogen dioxide)
Good
0.4/100
O3 (ozone)
Good
10.4/100
SO2 (sulfur dioxide)
Good
0.1/100
CO (carbon monoxide)
Good
0.4/100
HCHO (formaldehyde)
Good
0.7/100
PM1 (ultrafine particles)
Good
1.2/100
ENVIRONMENT & ANALYSIS

Local Environmental Conditions

Around this part of Tallahassee, traffic is light and there are few concentrated sources of air pollution. The surrounding woodland releases natural compounds that, in warm sunny weather, help form ozone. Winds are often light, which allows pollutants to linger close to where they are produced. Air arriving from elsewhere in the region adds to what is produced locally.

Warm, sunny weather from May to October, around 28°C at its peak, raises afternoon ozone levels. Cold spells from December to February, at around 10°C on average, are when smoke from wood burning and traffic lingers longest. From one day to the next, still, dry weather allows pollution to accumulate, and wind or rain clears it out.

Get pollen & AQ on Strava

Follow your environmental exposure and performance with the free Airmine-Strava integration. See your pollen and air quality exposure for every Strava activity.

Resource Hub

Pollen forecasts for Tallahassee Mold forecasts for Tallahassee
Air quality forecast neighborhoods 73 neighborhoods
Alfred B. Maclay Gardens State Park
AQI today AQI tomorrow
All Saints
AQI today AQI tomorrow
Anita Davis Preserve at Henrietta Lake Park
AQI today AQI tomorrow
Avalon at Maclay
AQI today AQI tomorrow
B.Calvin Jones Center for Archaeology
AQI today AQI tomorrow

Frequently Asked Questions About Air Quality in Florida

Is air quality bad in Meandering Lane right now?

On 10 October 2026, overall air quality in Meandering Lane is moderate. AQI is the main air quality indicator at 47.1/100. Pollution peaks around 8:00 PM (PM10: 47.1/100).

Will air quality be worse tomorrow in Meandering Lane?

On 11 October 2026, air quality conditions in Meandering Lane will be similar to today, with AQI forecast at moderate at 40.2/100. Pollution peaks around 2:00 AM (PM10: 40.2/100).

When is air pollution at its worst in Meandering Lane?

Warm, sunny weather from May to October, around 28°C at its peak, raises afternoon ozone levels. Cold spells from December to February, at around 10°C on average, are when smoke from wood burning and traffic lingers longest. From one day to the next, still, dry weather allows pollution to accumulate, and wind or rain clears it out.

Are air quality levels in Meandering Lane based on measurements or forecasts?

It is forecasts derived by downscaling forecasts provided by EU’s Copernicus Atmosphere Monitoring Service (CAMS) by taking into account local conditions such as traffic patterns. CAMS bases its forecast on satellite measurements of particles and chemical compounds in the atmosphere. Airmine’s services were developed with support from the European Space Agency (ESA)’s Business Applications and Space Solutions (BASS) team.

Why doesn’t the forecast always reflect wildfire impacts?

Airmine’s forecast uses CAMS (Copernicus Atmosphere Monitoring Service) as its background atmospheric model. While CAMS includes wildfire emissions, these are derived from satellite observations and are not available in real time. During rapidly evolving wildfire events, there may therefore be a delay before increased emissions are incorporated into the model. As a result, the forecast may temporarily underestimate PM₂.₅ and other pollutants associated with wildfire smoke.

During rapidly evolving wildfire events, CAMS may lag by approximately 1–2 days before increased wildfire emissions are fully represented, which can lead to temporary underestimation of PM₂.₅ concentrations in Airmine’s forecast.

Understanding the Scale

The 0–100 air quality scores represent risk levels, not direct air pollutant concentrations. Higher scores indicate higher risk.

Air Quality

Good
0-20 Low air quality risk. Air quality is expected to be good, with low levels of pollution.
Fair
20-40 Generally low air quality risk. Air quality is expected to be acceptable, with some pollution present.
Moderate
40-60 Moderate air quality risk. Air pollution is elevated and air quality may be less favorable.
Poor
60-80 High air quality risk. Air pollution is high and air quality is expected to be poor.
Very Poor
80-100 Very high air quality risk. Air pollution is very high and air quality is expected to be very poor.

Airmine’s atmospheric monitoring platform was developed with support from the European Space Agency (ESA)’s Business Applications and Space Solutions (BASS) team, using satellite and Earth observation technologies to improve emissions monitoring. This page provides the latest public air quality forecast for Tallahassee.

Data provided by Airmine — Last update: 11 October 2026 at 03:11 CEST (Data is updated four times daily.)

Methodology & Technology

Airmine combines satellite observations, weather forecasts and machine learning to forecast pollen, air quality and mold risk. For pollen, vegetation maps and weather data help predict season onset and exposure at 400 × 400 metre resolution. For air quality, we refine Copernicus CAMS forecasts using local factors such as roads, emissions and terrain. For routes, data is updated dynamically to provide accurate exposure metrics along the specific race corridor coordinates.

Our models are calibrated against millions of professional monitoring records and updated four times daily as new data becomes available.

Unless stated otherwise, this content is Airmine’s sole responsibility and has not been paid for by external organisations.

Disclaimer

The information provided is for environmental awareness only and does not constitute medical advice. Athletes with known respiratory conditions or severe allergies should consult their physician before participating in strenuous outdoor activities based on these forecasts.

Some text on this page may be generated or summarised using artificial intelligence (AI). Wherever possible, AI-generated content is enriched with Airmine's proprietary data to improve its accuracy and relevance. However, AI-generated content may still contain errors, omissions, or inaccuracies.