Miami Air Quality Forecast - Today, Tomorrow

Air Quality Today

Very poor 100/100

Today (10 October): Air quality in Miami is very poor. AQI and PM10 are very poor; PM2.5 is poor; NO2, O3, SO2, CO, HCHO, and PM1 are good. Pollution peaks around 8:00 AM (PM10: 100/100).

Air Quality Tomorrow

Poor 78/100

Tomorrow (11 October 2026): Air quality in Miami is poor. AQI improves to poor; PM2.5 decreases to moderate; PM10 decreases to poor; all other pollutants stay as today. Pollution peaks around 1:00 AM (PM10: 78.0/100).

Updated: 10 October 2026 at 20:32 CEST
Country: United States

Explore Forecasts

Air Quality Forecast for Neighborhoods

91 neighborhoods in Miami

1938 Concrete Ramp AQI today AQI tomorrow American Museum of the Cuban Diaspora AQI today AQI tomorrow Art Deco Historic District AQI today AQI tomorrow ArtSpace CityLoftArt AQI today AQI tomorrow Bay of Pigs Museum AQI today AQI tomorrow Bayfront Park AQI today AQI tomorrow Bill Sadowski Critical Wildlife Area AQI today AQI tomorrow Brickell AQI today AQI tomorrow Brickell Mausoleum AQI today AQI tomorrow Buena Vista AQI today AQI tomorrow Bunnies Encounter AQI today AQI tomorrow Calle Ocho Walk of Fame AQI today AQI tomorrow Calle Ocho Walk of Fame. West. AQI today AQI tomorrow Carnival Cruise AQI today AQI tomorrow Challenger Memorial AQI today AQI tomorrow Claude D. Pepper AQI today AQI tomorrow Coconut Grove AQI today AQI tomorrow Coral Gables AQI today AQI tomorrow Dade County War Memorial AQI today AQI tomorrow Design District AQI today AQI tomorrow Dinner Key AQI today AQI tomorrow Downtown Miami AQI today AQI tomorrow Edgewater AQI today AQI tomorrow Eternal Torch AQI today AQI tomorrow Everglades National Park AQI today AQI tomorrow Flamingo Encounter AQI today AQI tomorrow Fort Dallas AQI today AQI tomorrow Freedom Tower at Miami Dade College AQI today AQI tomorrow General Antonio Macro memorial AQI today AQI tomorrow Gigant Tortoise AQI today AQI tomorrow Historic Black Police Precinct Courthouse and Museum AQI today AQI tomorrow Historic South Miami Avenue Sign AQI today AQI tomorrow Historic Virginia Key Beach Park AQI today AQI tomorrow HistoryMiami Museum AQI today AQI tomorrow Hobie Island Beach AQI today AQI tomorrow Hobie Island Beach Park AQI today AQI tomorrow Ichimura Miami Japanese Garden AQI today AQI tomorrow Insegna LITTLE HAVANA AQI today AQI tomorrow Institute of Contemporary Art, Miami AQI today AQI tomorrow Jose Marti Memorial AQI today AQI tomorrow Julia B. Tuttle's Homestead AQI today AQI tomorrow Julia Deforest Tuttle AQI today AQI tomorrow Julia Sturtevant Tuttle AQI today AQI tomorrow Large Jewish Throne AQI today AQI tomorrow Latin American Art Museum AQI today AQI tomorrow Lemur Encounter AQI today AQI tomorrow Liberty City AQI today AQI tomorrow Little Haiti AQI today AQI tomorrow Little Havana AQI today AQI tomorrow Lock & Load Miami Range AQI today AQI tomorrow Madonna Statue AQI today AQI tomorrow Miami Children's Museum AQI today AQI tomorrow Miami Design District AQI today AQI tomorrow Miami Riverwalk AQI today AQI tomorrow Miami seaplane tour AQI today AQI tomorrow Midtown AQI today AQI tomorrow Midtown Miami AQI today AQI tomorrow Mildred and Claude Pepper Fountain AQI today AQI tomorrow MSC Cruises AQI today AQI tomorrow MSC Cruises Port AQI today AQI tomorrow Museum of Graffiti AQI today AQI tomorrow Museum of the Americas AQI today AQI tomorrow Norwegian Cruise Line AQI today AQI tomorrow Norwegian Port AQI today AQI tomorrow Oakland Grove AQI today AQI tomorrow Our Heroes - AQI today AQI tomorrow Overtown AQI today AQI tomorrow PARADOX Museum Miami AQI today AQI tomorrow Patricia and Phillip Frost Museum of Science AQI today AQI tomorrow Pérez Art Museum Miami AQI today AQI tomorrow Primates AQI today AQI tomorrow Royal Caribbean Port AQI today AQI tomorrow Rubell Museum AQI today AQI tomorrow Section of the Berlin Wall AQI today AQI tomorrow Simon Bolivar AQI today AQI tomorrow South Beach AQI today AQI tomorrow South Beach (Ocean Drive) AQI today AQI tomorrow Spanish Navy Plaza AQI today AQI tomorrow Street Art AQI today AQI tomorrow The Congress Building AQI today AQI tomorrow The Liberty Column AQI today AQI tomorrow The Torch of Friendship AQI today AQI tomorrow Thriller Miami Speedboat Adventures AQI today AQI tomorrow Tour Boat Boarding AQI today AQI tomorrow U.S. Coast Guard Station Hangar AQI today AQI tomorrow Villa Vizcaya AQI today AQI tomorrow Vizcaya Museum & Gardens AQI today AQI tomorrow War AQI today AQI tomorrow Wynwood AQI today AQI tomorrow Wynwood Arts District AQI today AQI tomorrow Wynwood Walls AQI today AQI tomorrow

Get More in Our App

Local pollen and air quality forecasts, interactive pollen maps and route profiles

Download on the App Store Get it on Google Play

Features and forecast availability vary by region.
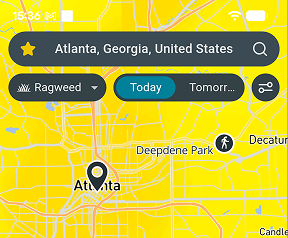
Airmine app pollen map

Air Quality

Today - 10 October

Pollutant Level Value
AQI
Very poor
100/100
PM2.5 (fine particles)
Poor
71.3/100
PM10 (coarse particles)
Very poor
100/100
NO2 (nitrogen dioxide)
Good
0.2/100
O3 (ozone)
Good
8.7/100
SO2 (sulfur dioxide)
Good
0.1/100
CO (carbon monoxide)
Good
0.4/100
HCHO (formaldehyde)
Good
0.8/100
PM1 (ultrafine particles)
Good
6.4/100

Tomorrow - 11 October

Pollutant Level Value
AQI
Poor
78.0/100
PM2.5 (fine particles)
Moderate
43.7/100
PM10 (coarse particles)
Poor
78.0/100
NO2 (nitrogen dioxide)
Good
1.1/100
O3 (ozone)
Good
8.4/100
SO2 (sulfur dioxide)
Good
0.1/100
CO (carbon monoxide)
Good
0.4/100
HCHO (formaldehyde)
Good
0.8/100
PM1 (ultrafine particles)
Good
3.6/100
ENVIRONMENT & ANALYSIS

Local Environmental Conditions

With buildings covering much of the area around the center of Miami, traffic and other urban emissions are the biggest local influence on air quality. Pockets of trees and green space help filter a small share of the particles from traffic. Winds here are fairly strong, averaging around 15 km/h, which helps disperse local pollution. Air arriving from elsewhere in the region adds to what is produced locally.

The dry season, roughly December to March, brings the haziest air, as dust and smoke build up without rain to clear them. Heavy rains from August to September clear the air most effectively. With temperatures around 26°C all year, sunny afternoons can raise ozone levels in any month, especially near busy roads.

Get pollen & AQ on Strava

Follow your environmental exposure and performance with the free Airmine-Strava integration. See your pollen and air quality exposure for every Strava activity.

Resource Hub

Pollen forecasts for Miami Mold forecasts for Miami
Air quality forecast neighborhoods 91 neighborhoods
1938 Concrete Ramp
AQI today AQI tomorrow
American Museum of the Cuban Diaspora
AQI today AQI tomorrow
Art Deco Historic District
AQI today AQI tomorrow
ArtSpace CityLoftArt
AQI today AQI tomorrow
Bay of Pigs Museum
AQI today AQI tomorrow
Sports venues in Miami 1 sports venue
Local events 1 event

Frequently Asked Questions About Air Quality in Florida

Is air quality bad in Miami right now?

On 10 October 2026, overall air quality in Miami is very poor. AQI is the main air quality indicator at 100/100. Pollution peaks around 8:00 AM (PM10: 100/100).

Will air quality be worse tomorrow in Miami?

On 11 October 2026, air quality conditions in Miami will be better than today, with AQI forecast at poor at 78.0/100. Pollution peaks around 1:00 AM (PM10: 78.0/100).

When is air pollution at its worst in Miami?

The dry season, roughly December to March, brings the haziest air, as dust and smoke build up without rain to clear them. Heavy rains from August to September clear the air most effectively. With temperatures around 26°C all year, sunny afternoons can raise ozone levels in any month, especially near busy roads.

Are air quality levels in Miami based on measurements or forecasts?

It is forecasts derived by downscaling forecasts provided by EU’s Copernicus Atmosphere Monitoring Service (CAMS) by taking into account local conditions such as traffic patterns. CAMS bases its forecast on satellite measurements of particles and chemical compounds in the atmosphere. Airmine’s services were developed with support from the European Space Agency (ESA)’s Business Applications and Space Solutions (BASS) team.

Why doesn’t the forecast always reflect wildfire impacts?

Airmine’s forecast uses CAMS (Copernicus Atmosphere Monitoring Service) as its background atmospheric model. While CAMS includes wildfire emissions, these are derived from satellite observations and are not available in real time. During rapidly evolving wildfire events, there may therefore be a delay before increased emissions are incorporated into the model. As a result, the forecast may temporarily underestimate PM₂.₅ and other pollutants associated with wildfire smoke.

During rapidly evolving wildfire events, CAMS may lag by approximately 1–2 days before increased wildfire emissions are fully represented, which can lead to temporary underestimation of PM₂.₅ concentrations in Airmine’s forecast.

Understanding the Scale

The 0–100 air quality scores represent risk levels, not direct air pollutant concentrations. Higher scores indicate higher risk.

Air Quality

Good
0-20 Low air quality risk. Air quality is expected to be good, with low levels of pollution.
Fair
20-40 Generally low air quality risk. Air quality is expected to be acceptable, with some pollution present.
Moderate
40-60 Moderate air quality risk. Air pollution is elevated and air quality may be less favorable.
Poor
60-80 High air quality risk. Air pollution is high and air quality is expected to be poor.
Very Poor
80-100 Very high air quality risk. Air pollution is very high and air quality is expected to be very poor.

Airmine’s atmospheric monitoring platform was developed with support from the European Space Agency (ESA)’s Business Applications and Space Solutions (BASS) team, using satellite and Earth observation technologies to improve emissions monitoring. This page provides the latest public air quality forecast for Miami.

Data provided by Airmine — Last update: 10 October 2026 at 20:32 CEST (Data is updated four times daily.)

Methodology & Technology

Airmine combines satellite observations, weather forecasts and machine learning to forecast pollen, air quality and mold risk. For pollen, vegetation maps and weather data help predict season onset and exposure at 400 × 400 metre resolution. For air quality, we refine Copernicus CAMS forecasts using local factors such as roads, emissions and terrain. For routes, data is updated dynamically to provide accurate exposure metrics along the specific race corridor coordinates.

Our models are calibrated against millions of professional monitoring records and updated four times daily as new data becomes available.

Unless stated otherwise, this content is Airmine’s sole responsibility and has not been paid for by external organisations.

Disclaimer

The information provided is for environmental awareness only and does not constitute medical advice. Athletes with known respiratory conditions or severe allergies should consult their physician before participating in strenuous outdoor activities based on these forecasts.

Some text on this page may be generated or summarised using artificial intelligence (AI). Wherever possible, AI-generated content is enriched with Airmine's proprietary data to improve its accuracy and relevance. However, AI-generated content may still contain errors, omissions, or inaccuracies.