Alexander Hodge Memorial, Houston Air Quality Forecast - Today, Tomorrow

Air Quality Today

Very poor 100/100

Today (10 October): Air quality in Alexander Hodge Memorial is very poor. AQI and PM10 are very poor; PM2.5 is moderate; NO2, O3, SO2, CO, HCHO, and PM1 are good. Pollution peaks around 3:00 PM (PM10: 100/100).

Air Quality Tomorrow

Poor 71/100

Tomorrow (11 October 2026): Air quality in Alexander Hodge Memorial is poor. AQI improves to poor; PM10 decreases to poor; all other pollutants stay as today. Pollution peaks around 10:00 AM (PM10: 70.7/100).

Updated: 11 October 2026 at 03:11 CEST
Country: United States

Explore Forecasts

Air Quality Forecast for Neighborhoods

100 neighborhoods in Houston

1940 Air Terminal Museum AQI today AQI tomorrow Alexander Hodge Memorial AQI today AQI tomorrow Alief AQI today AQI tomorrow Almeda AQI today AQI tomorrow Art Car Museum AQI today AQI tomorrow Audobon Place AQI today AQI tomorrow Audrey Jones Beck Building AQI today AQI tomorrow Bellaire West AQI today AQI tomorrow Bevil Jarrell Memorial Bridge AQI today AQI tomorrow Blaffer Art Museum AQI today AQI tomorrow Briargrove AQI today AQI tomorrow Broadacres AQI today AQI tomorrow Buffalo Bayou Park AQI today AQI tomorrow Byzantine Fresco Chapel Museum AQI today AQI tomorrow Calgary Woods AQI today AQI tomorrow Caroline Weiss Law Building AQI today AQI tomorrow Central City AQI today AQI tomorrow Children's Museum Houston AQI today AQI tomorrow Children's Museum of Houston AQI today AQI tomorrow Chinatown AQI today AQI tomorrow City Oaks AQI today AQI tomorrow Columbia Memorial AQI today AQI tomorrow Contemporary Arts Museum Houston AQI today AQI tomorrow Cy Twombly Gallery AQI today AQI tomorrow Discovery Green AQI today AQI tomorrow Dunnam AQI today AQI tomorrow EaDo AQI today AQI tomorrow Edgar Odell Lovett AQI today AQI tomorrow Edgeworth Place AQI today AQI tomorrow Fourth Ward AQI today AQI tomorrow Freedmen's Town Historic District AQI today AQI tomorrow Heights AQI today AQI tomorrow Hermann Park AQI today AQI tomorrow Hidden Echo AQI today AQI tomorrow Highland Village AQI today AQI tomorrow Holocaust Museum Houston AQI today AQI tomorrow Houston Heights AQI today AQI tomorrow Houston Museum of Natural Science AQI today AQI tomorrow Houston Police Officers' Memorial AQI today AQI tomorrow Humble Camp AQI today AQI tomorrow Independence Heights AQI today AQI tomorrow John P. McGovern Museum of Health and Medical Science AQI today AQI tomorrow Kingwood AQI today AQI tomorrow KOA Holiday AQI today AQI tomorrow Lakeview RV Resort AQI today AQI tomorrow Lamar Terrace AQI today AQI tomorrow Laurel Springs RV Resort AQI today AQI tomorrow Little Dipper AQI today AQI tomorrow Lynchburg Landing AQI today AQI tomorrow Mahatma Gandhi AQI today AQI tomorrow Mahatma Gandhi District AQI today AQI tomorrow Martin Luther King Jr. AQI today AQI tomorrow McKee Street AQI today AQI tomorrow Menil Collection AQI today AQI tomorrow Menil Drawing Institute AQI today AQI tomorrow Meyerland AQI today AQI tomorrow Midtown AQI today AQI tomorrow Minnetex AQI today AQI tomorrow Montrose AQI today AQI tomorrow Moonshine Hill AQI today AQI tomorrow Mount Houston AQI today AQI tomorrow Murray Park AQI today AQI tomorrow Museum District AQI today AQI tomorrow Museum of American Architecture and Decorative Arts AQI today AQI tomorrow Museum of Fine Arts Houston AQI today AQI tomorrow Museum of Printing History AQI today AQI tomorrow NASA Johnson Space Center AQI today AQI tomorrow North San Jacinto Street AQI today AQI tomorrow North Shadydale AQI today AQI tomorrow Oates Prairie AQI today AQI tomorrow Pamela Heights AQI today AQI tomorrow Paul Building AQI today AQI tomorrow Proctor Museum of Natural Science AQI today AQI tomorrow Rafferty Memorial Oak AQI today AQI tomorrow Rice Military AQI today AQI tomorrow Rice Village AQI today AQI tomorrow River Oaks AQI today AQI tomorrow Riverside Crest AQI today AQI tomorrow Rothko Chapel AQI today AQI tomorrow Sam Houston Hotel AQI today AQI tomorrow Sam Houston Monument AQI today AQI tomorrow Scenic Woods AQI today AQI tomorrow Shuttle Independence AQI today AQI tomorrow Skyscraper Shadows AQI today AQI tomorrow Somerset Green AQI today AQI tomorrow South Jensen Drive AQI today AQI tomorrow South Main RV Park AQI today AQI tomorrow Space Center Houston AQI today AQI tomorrow Tanglewood AQI today AQI tomorrow Texas knife makers supply AQI today AQI tomorrow The Buffalo Soldiers National Museum AQI today AQI tomorrow The Glassell School of Art AQI today AQI tomorrow The Heights AQI today AQI tomorrow The Orange Show AQI today AQI tomorrow Third Ward AQI today AQI tomorrow Union Station AQI today AQI tomorrow Uptown AQI today AQI tomorrow Vince's Bridge AQI today AQI tomorrow Westbury AQI today AQI tomorrow World War I Monument AQI today AQI tomorrow

Get More in Our App

Local pollen and air quality forecasts, interactive pollen maps and route profiles

Download on the App Store Get it on Google Play

Features and forecast availability vary by region.
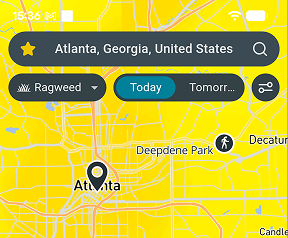
Airmine app pollen map

Air Quality

Today - 10 October

Pollutant Level Value
AQI
Very poor
100/100
PM2.5 (fine particles)
Moderate
57.9/100
PM10 (coarse particles)
Very poor
100/100
NO2 (nitrogen dioxide)
Good
0.7/100
O3 (ozone)
Good
8.3/100
SO2 (sulfur dioxide)
Good
0.1/100
CO (carbon monoxide)
Good
0.4/100
HCHO (formaldehyde)
Good
0.8/100
PM1 (ultrafine particles)
Good
3.6/100

Tomorrow - 11 October

Pollutant Level Value
AQI
Poor
70.7/100
PM2.5 (fine particles)
Moderate
45.6/100
PM10 (coarse particles)
Poor
70.7/100
NO2 (nitrogen dioxide)
Good
1.2/100
O3 (ozone)
Good
12.0/100
SO2 (sulfur dioxide)
Good
0.1/100
CO (carbon monoxide)
Good
0.4/100
HCHO (formaldehyde)
Good
1.0/100
PM1 (ultrafine particles)
Good
2.5/100
ENVIRONMENT & ANALYSIS

Local Environmental Conditions

This part of Houston is largely built up, so vehicle exhaust and urban activity dominate the local air pollution sources. Parks and street trees provide a modest buffer against traffic pollution. On some days, pollution drifting in from farther away outweighs local sources. Levels are generally highest right next to busy roads and drop off quickly with distance.

Summer sun from April to October cooks traffic fumes into ozone, especially in the warmest month, which averages 30°C. In the mildest months, December to February, calmer nights at around 10°C allow traffic pollution to build up near the ground. On the plus side, stronger winds around April, about 15 km/h on average, usually bring some of the cleanest air of the year.

Get pollen & AQ on Strava

Follow your environmental exposure and performance with the free Airmine-Strava integration. See your pollen and air quality exposure for every Strava activity.

Resource Hub

Pollen forecasts for Houston Mold forecasts for Houston
Air quality forecast neighborhoods 100 neighborhoods
1940 Air Terminal Museum
AQI today AQI tomorrow
Alexander Hodge Memorial
AQI today AQI tomorrow
Alief
AQI today AQI tomorrow
Almeda
AQI today AQI tomorrow
Art Car Museum
AQI today AQI tomorrow
Sports venues in Houston 4 sports venues

Frequently Asked Questions About Air Quality in Texas

Is air quality bad in Alexander Hodge Memorial right now?

On 10 October 2026, overall air quality in Alexander Hodge Memorial is very poor. AQI is the main air quality indicator at 100/100. Pollution peaks around 3:00 PM (PM10: 100/100).

Will air quality be worse tomorrow in Alexander Hodge Memorial?

On 11 October 2026, air quality conditions in Alexander Hodge Memorial will be better than today, with AQI forecast at poor at 70.7/100. Pollution peaks around 10:00 AM (PM10: 70.7/100).

When is air pollution at its worst in Alexander Hodge Memorial?

Summer sun from April to October cooks traffic fumes into ozone, especially in the warmest month, which averages 30°C. In the mildest months, December to February, calmer nights at around 10°C allow traffic pollution to build up near the ground. On the plus side, stronger winds around April, about 15 km/h on average, usually bring some of the cleanest air of the year.

Are air quality levels in Alexander Hodge Memorial based on measurements or forecasts?

It is forecasts derived by downscaling forecasts provided by EU’s Copernicus Atmosphere Monitoring Service (CAMS) by taking into account local conditions such as traffic patterns. CAMS bases its forecast on satellite measurements of particles and chemical compounds in the atmosphere. Airmine’s services were developed with support from the European Space Agency (ESA)’s Business Applications and Space Solutions (BASS) team.

Why doesn’t the forecast always reflect wildfire impacts?

Airmine’s forecast uses CAMS (Copernicus Atmosphere Monitoring Service) as its background atmospheric model. While CAMS includes wildfire emissions, these are derived from satellite observations and are not available in real time. During rapidly evolving wildfire events, there may therefore be a delay before increased emissions are incorporated into the model. As a result, the forecast may temporarily underestimate PM₂.₅ and other pollutants associated with wildfire smoke.

During rapidly evolving wildfire events, CAMS may lag by approximately 1–2 days before increased wildfire emissions are fully represented, which can lead to temporary underestimation of PM₂.₅ concentrations in Airmine’s forecast.

Understanding the Scale

The 0–100 air quality scores represent risk levels, not direct air pollutant concentrations. Higher scores indicate higher risk.

Air Quality

Good
0-20 Low air quality risk. Air quality is expected to be good, with low levels of pollution.
Fair
20-40 Generally low air quality risk. Air quality is expected to be acceptable, with some pollution present.
Moderate
40-60 Moderate air quality risk. Air pollution is elevated and air quality may be less favorable.
Poor
60-80 High air quality risk. Air pollution is high and air quality is expected to be poor.
Very Poor
80-100 Very high air quality risk. Air pollution is very high and air quality is expected to be very poor.

Airmine’s atmospheric monitoring platform was developed with support from the European Space Agency (ESA)’s Business Applications and Space Solutions (BASS) team, using satellite and Earth observation technologies to improve emissions monitoring. This page provides the latest public air quality forecast for Houston.

Data provided by Airmine — Last update: 11 October 2026 at 03:11 CEST (Data is updated four times daily.)

Methodology & Technology

Airmine combines satellite observations, weather forecasts and machine learning to forecast pollen, air quality and mold risk. For pollen, vegetation maps and weather data help predict season onset and exposure at 400 × 400 metre resolution. For air quality, we refine Copernicus CAMS forecasts using local factors such as roads, emissions and terrain. For routes, data is updated dynamically to provide accurate exposure metrics along the specific race corridor coordinates.

Our models are calibrated against millions of professional monitoring records and updated four times daily as new data becomes available.

Unless stated otherwise, this content is Airmine’s sole responsibility and has not been paid for by external organisations.

Disclaimer

The information provided is for environmental awareness only and does not constitute medical advice. Athletes with known respiratory conditions or severe allergies should consult their physician before participating in strenuous outdoor activities based on these forecasts.

Some text on this page may be generated or summarised using artificial intelligence (AI). Wherever possible, AI-generated content is enriched with Airmine's proprietary data to improve its accuracy and relevance. However, AI-generated content may still contain errors, omissions, or inaccuracies.