Tønsberg Air Quality Forecast - Today, Tomorrow

Air Quality Today

Good 17/100

Today (19 October): Air quality in Tønsberg is good. AQI, PM2.5, PM10, NO2, O3, SO2, CO, HCHO, and PM1 are good. Pollution peaks around 3:00 PM (O3: 19.2/100).

Air Quality Tomorrow

Good 17/100

Tomorrow (20 October 2026): Air quality in Tønsberg is good. All pollutants stay as today. Pollution peaks around 1:00 AM (O3: 19.7/100).

Updated: 19 October 2026 at 23:41 CEST
Country: Norway

Explore Forecasts

Routes in Tønsberg

89 routes in Tønsberg

Across Finnemarka 28.2 km Pollen Air quality Akerselva Riverwalk 7.2 km Pollen Air quality Bygdøy Loop 13 km Pollen Air quality Ekebergparken Sculpture Walk 4 km Pollen Air quality Frognerseteren-Kikut Loop 31.2 km Pollen Air quality Havnepromenaden 8.9 km Pollen Air quality Holmenkollmarka Loop 4.9 km Pollen Air quality Hvervenbukta–Ljan Coastal Trail 2.6 km Pollen Air quality Ingierstrand Beach Promenade 15 km Pollen Air quality Jarmyra 1 km Pollen Air quality Kolsåstoppen 8 km Pollen Air quality Kyststien i Kragerø 24 km Pollen Air quality Kyststien Stabbestad - Ellingsviken 21.3 km Pollen Air quality Maridalen Loop 16 km Pollen Air quality Mylla-Sognsvann 46 km Pollen Air quality Nordre Gravlund Loop 2 km Pollen Air quality Risør Loop 5 km Pollen Air quality Sognsvann Loop 4 km Pollen Air quality Sørkedalen-Ringkollen-Vidvangen Loop 58 km Pollen Air quality Tour de Finance 10 km Pollen Air quality Tryvannshøgda Loop 4 km Pollen Air quality Vettakollen 8 km Pollen Air quality Zikk-Zakken 1 km Pollen Air quality Alby Gård parkrun 5 km Pollen Air quality Berger Stadion parkrun 5 km Pollen Air quality Ekebergsletta parkrun 5 km Pollen Air quality Flomvollen parkrun 5 km Pollen Air quality Greveskogen parkrun 5 km Pollen Air quality Nansenparken parkrun 5 km Pollen Air quality Skien Fritidspark parkrun 5 km Pollen Air quality Tøyen parkrun 5 km Pollen Air quality Bjørndalenmila 10 km Pollen Air quality Blefjells Beste 53 km Pollen Air quality Brunlaneslopet 9 km Pollen Air quality Bygdøymila 10K 10 km Pollen Air quality Bygdøymila 3K 3 km Pollen Air quality Bygdøymila 6K 6 km Pollen Air quality Drammen 10K 10 km Pollen Air quality Drammen Half Marathon 21 km Pollen Air quality EcoTrail Oslo 80 km Pollen Air quality Fornebuløpet 10 km Pollen Air quality Fredrikstad Marathon 42 km Pollen Air quality Fredrikstadløpet 21 km Pollen Air quality Fredrikstadmarka Rundt 20 km Pollen Air quality Glommaløpet 16 km Pollen Air quality Hedersløpet 10K 10 km Pollen Air quality Holmenkollstafetten 18 km Pollen Air quality Holmestrand Marathon 21 km Pollen Air quality Høvikløpet 5 km Pollen Air quality Hytteplanmila 10 km Pollen Air quality Ivar Formos Minneløp 17 km Pollen Air quality Janteloppet Summer Edition 7 km Pollen Air quality Jentemila 10 km Pollen Air quality KK-mila 10 km Pollen Air quality Kristinaløpet 10 km Pollen Air quality Lierløpet 10K 10 km Pollen Air quality Lierløpet 5K 5 km Pollen Air quality Lierløpet Half Marathon 21 km Pollen Air quality Lommedalen Backyard 7 km Pollen Air quality Lommedalen Løpskarusell 5,5km 5 km Pollen Air quality Lommedalen Løpskarusell 8km 8 km Pollen Air quality Lommedalen Løpskarusell 9km 9 km Pollen Air quality Lommedalen Opp 2 km Pollen Air quality Lommedalen Rundt 19 km Pollen Air quality Löplabbets Ribbemaraton 42 km Pollen Air quality Markakarusellen 3km 3 km Pollen Air quality Markakarusellen 5km 5 km Pollen Air quality Markakarusellen 9km 9 km Pollen Air quality Markatier'n 10 km Pollen Air quality Nøklevann Rundt 10K 10 km Pollen Air quality Nøklevann Rundt 5K 5 km Pollen Air quality Nordmarka Skogsmaraton 42 km Pollen Air quality Nordmarkstravern 30 km Pollen Air quality Oslo Half Marathon 21 km Pollen Air quality Oslo Marathon 42 km Pollen Air quality Oslo Marathon 10 for Grete 10 km Pollen Air quality Oslo Trail Challenge 100K 100 km Pollen Air quality Oslo Trail Challenge 200K 200 km Pollen Air quality Oslo Trail Challenge 21K 21 km Pollen Air quality Oslo Trail Challenge 55K 55 km Pollen Air quality Oslo-Bergen Trail: S1 Oslo-Noresund 100 km Pollen Air quality Oslo-Bergen Trail: S2 Noresund-Flatvollen 45 km Pollen Air quality Oslos Bratteste 3 km Pollen Air quality Ringeriksmaraton 42 km Pollen Air quality Sentrumsløpet 10 km Pollen Air quality Skaubygdakarusellen 6 km Pollen Air quality Skaubygdaløpet 21 km Pollen Air quality Soria Moria til Verdens Ende 165 km Pollen Air quality Sørkedalsløpet 11 km Pollen Air quality

Get More in Our App

Local pollen and air quality forecasts, interactive pollen maps and route profiles

Download on the App Store Get it on Google Play

Features and forecast availability vary by region.
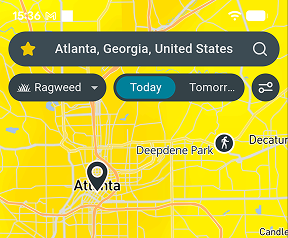
Airmine app pollen map

Air Quality

Today - 19 October

Pollutant Level Value
AQI
Good
16.6/100
PM2.5 (fine particles)
Good
9.0/100
PM10 (coarse particles)
Good
7.5/100
NO2 (nitrogen dioxide)
Good
7.9/100
O3 (ozone)
Good
16.6/100
SO2 (sulfur dioxide)
Good
0.4/100
CO (carbon monoxide)
Good
0.5/100
HCHO (formaldehyde)
Good
0.9/100
PM1 (ultrafine particles)
Good
6.6/100

Tomorrow - 20 October

Pollutant Level Value
AQI
Good
16.8/100
PM2.5 (fine particles)
Good
8.1/100
PM10 (coarse particles)
Good
7.1/100
NO2 (nitrogen dioxide)
Good
7.1/100
O3 (ozone)
Good
16.6/100
SO2 (sulfur dioxide)
Good
0.4/100
CO (carbon monoxide)
Good
0.5/100
HCHO (formaldehyde)
Good
1.0/100
PM1 (ultrafine particles)
Good
5.0/100
ENVIRONMENT & ANALYSIS

Local Environmental Conditions

The center of Tønsberg lies in a lightly developed area, where local traffic adds relatively little to air pollution. Local sources include industry. The fields nearby contribute dust during field work, as well as ammonia from fertilizer and manure that helps form fine particles in the air. Woodland in the area offers some natural filtering of particles from traffic.

Ozone rises a little on sunny days in July, but the mild summers, around 16°C, keep it in check. In contrast, the cooler months, October to April, see more fine particles, as wood burning and traffic add emissions while frequent calm, cold mornings around -6°C keep pollution near the ground. Wildfire smoke is most likely from June to August, sometimes turning the sky hazy for days.

Get pollen & AQ on Strava

Follow your environmental exposure and performance with the free Airmine-Strava integration. See your pollen and air quality exposure for every Strava activity.

Resource Hub

Pollen forecasts for Tønsberg Mold forecasts for Tønsberg
Popular Local Routes 23 routes
Local parkruns 8 parkruns
Local events 58 events
Bjørndalenmila 10 km
Pollen Air quality
Blefjells Beste 53 km
Pollen Air quality
Brunlaneslopet 9 km
Pollen Air quality
Bygdøymila 10K 10 km
Pollen Air quality
Bygdøymila 3K 3 km
Pollen Air quality

Frequently Asked Questions About Air Quality in Vestfold

Is air quality bad in Tønsberg right now?

On 19 October 2026, overall air quality in Tønsberg is good. AQI is the main air quality indicator at 16.6/100. Pollution peaks around 3:00 PM (O3: 19.2/100).

Will air quality be worse tomorrow in Tønsberg?

On 20 October 2026, air quality conditions in Tønsberg will be similar to today, with AQI forecast at good at 16.8/100. Pollution peaks around 1:00 AM (O3: 19.7/100).

When is air pollution at its worst in Tønsberg?

Ozone rises a little on sunny days in July, but the mild summers, around 16°C, keep it in check. In contrast, the cooler months, October to April, see more fine particles, as wood burning and traffic add emissions while frequent calm, cold mornings around -6°C keep pollution near the ground. Wildfire smoke is most likely from June to August, sometimes turning the sky hazy for days.

Are air quality levels in Tønsberg based on measurements or forecasts?

It is forecasts derived by downscaling forecasts provided by EU’s Copernicus Atmosphere Monitoring Service (CAMS) by taking into account local conditions such as traffic patterns. CAMS bases its forecast on satellite measurements of particles and chemical compounds in the atmosphere. Airmine’s services were developed with support from the European Space Agency (ESA)’s Business Applications and Space Solutions (BASS) team.

Why doesn’t the forecast always reflect wildfire impacts?

Airmine’s forecast uses CAMS (Copernicus Atmosphere Monitoring Service) as its background atmospheric model. While CAMS includes wildfire emissions, these are derived from satellite observations and are not available in real time. During rapidly evolving wildfire events, there may therefore be a delay before increased emissions are incorporated into the model. As a result, the forecast may temporarily underestimate PM₂.₅ and other pollutants associated with wildfire smoke.

During rapidly evolving wildfire events, CAMS may lag by approximately 1–2 days before increased wildfire emissions are fully represented, which can lead to temporary underestimation of PM₂.₅ concentrations in Airmine’s forecast.

Understanding the Scale

The 0–100 air quality scores represent risk levels, not direct air pollutant concentrations. Higher scores indicate higher risk.

Air Quality

Good
0-20 Low air quality risk. Air quality is expected to be good, with low levels of pollution.
Fair
20-40 Generally low air quality risk. Air quality is expected to be acceptable, with some pollution present.
Moderate
40-60 Moderate air quality risk. Air pollution is elevated and air quality may be less favorable.
Poor
60-80 High air quality risk. Air pollution is high and air quality is expected to be poor.
Very Poor
80-100 Very high air quality risk. Air pollution is very high and air quality is expected to be very poor.

Airmine’s atmospheric monitoring platform was developed with support from the European Space Agency (ESA)’s Business Applications and Space Solutions (BASS) team, using satellite and Earth observation technologies to improve emissions monitoring. This page provides the latest public air quality forecast for Tønsberg.

Data provided by Airmine — Last update: 19 October 2026 at 23:41 CEST (Data is updated four times daily.)

Methodology & Technology

Airmine combines satellite observations, weather forecasts and machine learning to forecast pollen, air quality and mold risk. For pollen, vegetation maps and weather data help predict season onset and exposure at 400 × 400 metre resolution. For air quality, we refine Copernicus CAMS forecasts using local factors such as roads, emissions and terrain. For routes, data is updated dynamically to provide accurate exposure metrics along the specific race corridor coordinates.

Our models are calibrated against millions of professional monitoring records and updated four times daily as new data becomes available.

Unless stated otherwise, this content is Airmine’s sole responsibility and has not been paid for by external organisations.

Disclaimer

The information provided is for environmental awareness only and does not constitute medical advice. Athletes with known respiratory conditions or severe allergies should consult their physician before participating in strenuous outdoor activities based on these forecasts.

Some text on this page may be generated or summarised using artificial intelligence (AI). Wherever possible, AI-generated content is enriched with Airmine's proprietary data to improve its accuracy and relevance. However, AI-generated content may still contain errors, omissions, or inaccuracies.