
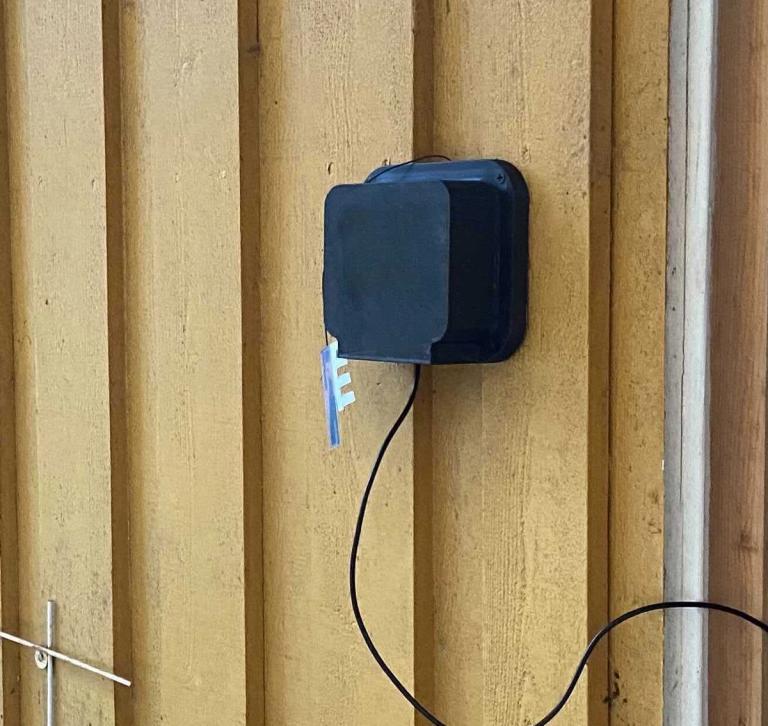
We are pilot testing our air quality monitors - and analyzing local PM-levels.
We are developing an air quality monitor that measures particle pollution (PM2.5 and PM10). The monitors are now in pilot test - and we have started to analyze the first results.
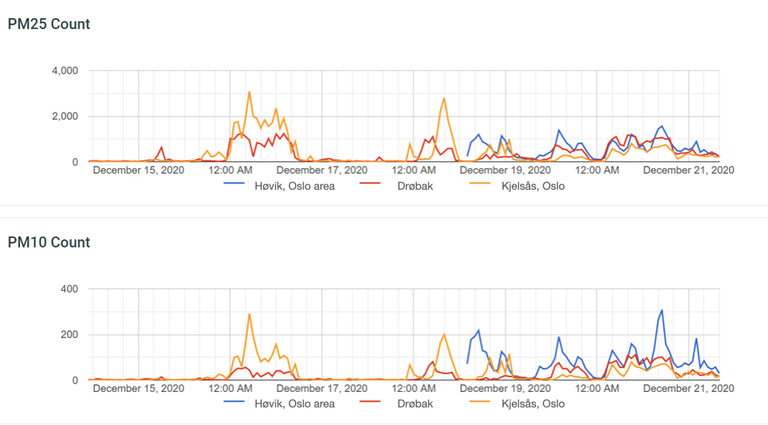
Three sites - same pattern
Below are results from three different pilot sites. They are all in the Oslo region, but 50km from each other and in various distances from major roads. We had expected local variations due to road traffic and wood burning stoves in the neighbourhood, but the results follow a similar pattern.
This led us to look for other correlations - and we did indeed find one.
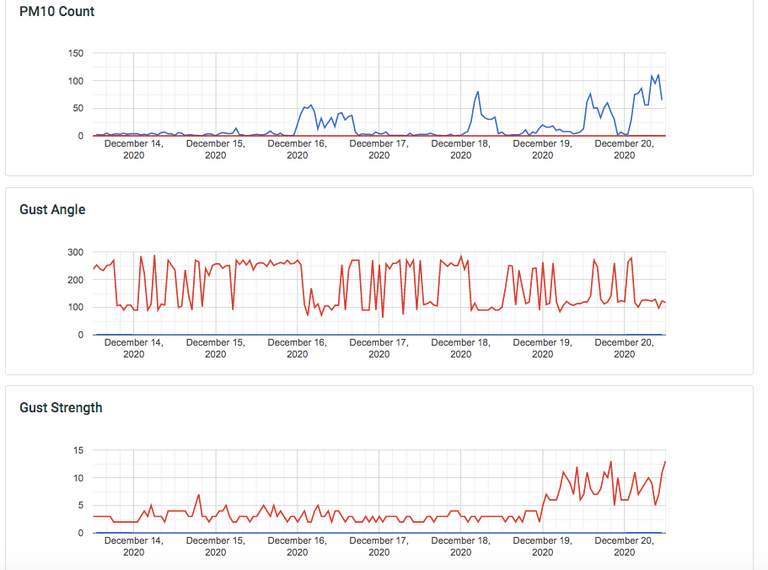
Wind from south gives particle pollution in the north
When we compare PM counts with wind direction and wind gust strength, we see a pattern. Wind from south gives higher particle levels (angle 100 in the gust angle graph below). It looks like the high level we record in Oslo is imported pollution from further south on the continent.
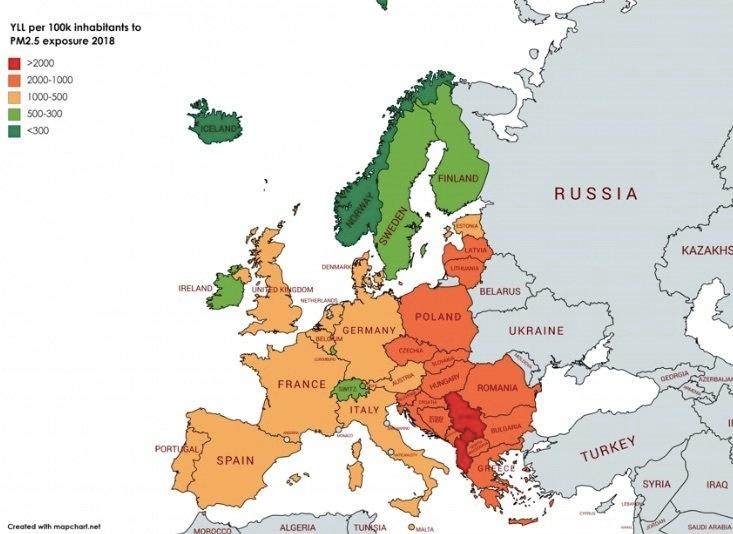
Winds from south and south-east are likely to transport pollution from Eastern Europe to Scandinavia. Europe's most polluted air can be found in a belt from Poland down to the Balkans, see the map below.
We have seen this before
Northwestern Europe is an area with mostly good air quality. However, we do see spikes in air pollution also in this region. One source is local pollution, such as dry weather and road dust being whirled up. In Oslo, PM-levels actually peaked right after the first Covid-19 lockdown had been imposed, see our story Oslo - less cars but bad air.
The other typical source is further away. Dust is being transported by winds from Eastern Europe or from even further away. A quite massive transport took place in October this year, making PM-levels soar and obscuring the sky in parts of Scandinavia, see our story Smoke from west? No, dust from east.
The pilot testing continues
We will continue pilot testing of our air quality monitor - and keep you posted on the development and findings.