
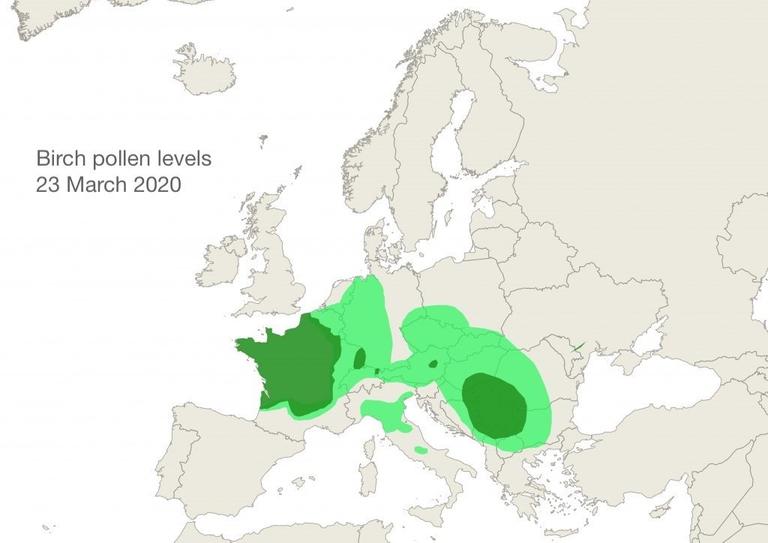
Pollen season has started in Western France and the front is about to move northwards
Over the last few days, birch pollen levels have increased across Central Europe. We are now at a stage where significant levels are recorded in Western France and on the Balkans/Austria, see the figure below. Levels are, however, still behind what they would normally be at this time of the year.
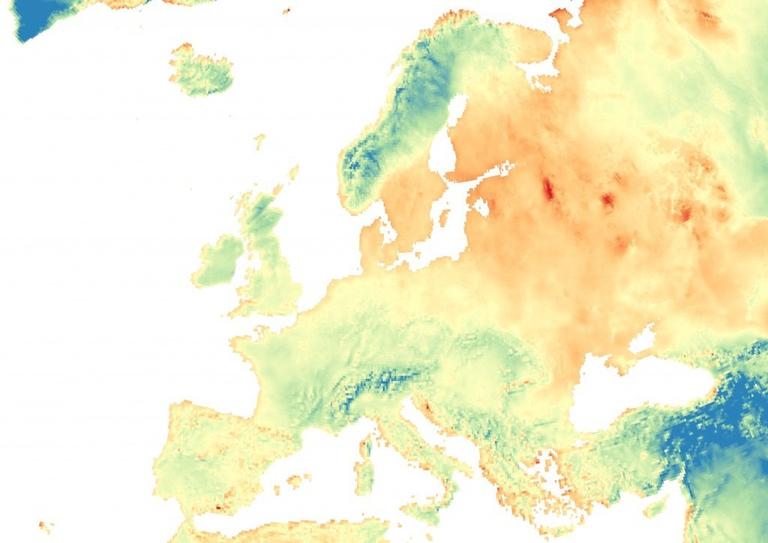
Over the next ten days, temperature is expected to be lower than normal in most of Europe, see the map below. There are exceptions: Denmark, Southern Sweden, the Baltic states, much of Poland and Belarus will be warmer than normal.
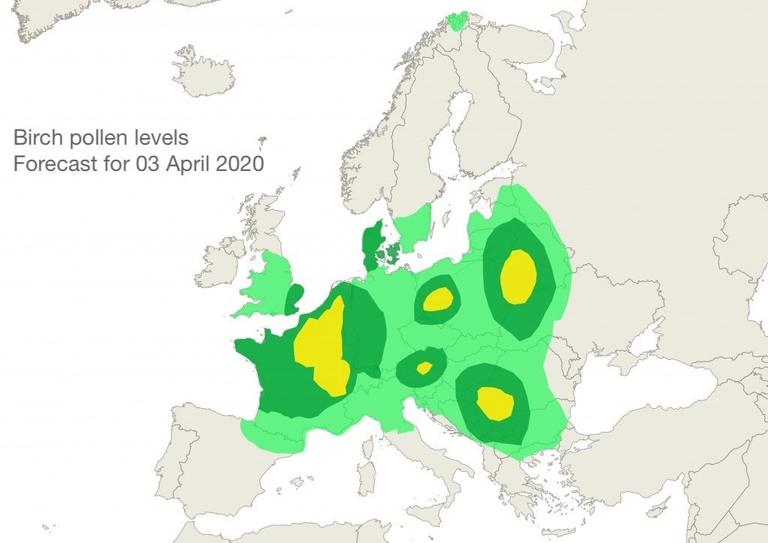
Central Europe and Southern Scandinavia can expect birch pollen next ten days
Looking ahead ten days, pollen levels are expected to stay below normal in most of Europe. This is due to temperatures lower than normal. However, we foresee birch pollen levels to increase to a moderate (yellow) level in several places across Europe (middle of France, the Balkans, Eastern Poland).
Moreover, the front is expected to move north and eastwards, covering Denmark and Southern Sweden. Even the northernmost part of Norway might see the start of season due to extraordinary high temperatures.
Follow the pollen season with Airmine
You may also be interested in our other stories on pollen in Europe. Our video showing the average development of birch pollen tells us that birch pollen is still behind an average season.
Credits: Maps and figures created with contributions from Rasmus Moldstad Bakken.