Dublin Air Quality Forecast - Today, Tomorrow

Air Quality Today

Good 19/100

Today (10 October): Air quality in Dublin is good. AQI, PM2.5, PM10, NO2, O3, SO2, CO, HCHO, and PM1 are good. Pollution peaks around 3:00 PM (O3: 19.2/100).

Air Quality Tomorrow

Good 19/100

Tomorrow (11 October 2026): Air quality in Dublin is good. All pollutants stay as today. Pollution peaks around 11:00 AM (PM2.5: 19.2/100).

Updated: 10 October 2026 at 20:32 CEST
Country: Ireland

Explore Forecasts

Routes in Dublin

74 routes in Dublin

Dublin Mountains Way 41.1 km Pollen Air quality Dublin Mountains Way - Hellfire & Massey Spur 7.6 km Pollen Air quality Fitwalk Circuit 0.6 km Pollen Air quality Howth Black Linn Loop 8.1 km Pollen Air quality Icon Walk 0.3 km Pollen Air quality Mourne Way 36.7 km Pollen Air quality Rathmichael Walk 1.7 km Pollen Air quality Sli Na Slainte Leixlip Sli 4 km Pollen Air quality Tymon Park Purple Sli 4.4 km Pollen Air quality Tymon Park Yellow Sli 2.3 km Pollen Air quality Albert College junior parkrun 2 km Pollen Air quality Arklow Duck Pond junior parkrun 2 km Pollen Air quality Avondale Forest parkrun 5 km Pollen Air quality Balbriggan junior parkrun 2 km Pollen Air quality Ballinamore Greenway parkrun 5 km Pollen Air quality Ballymount parkrun 5 km Pollen Air quality Baltinglass Park junior parkrun 2 km Pollen Air quality Belcamp junior parkrun 2 km Pollen Air quality Bray junior parkrun 2 km Pollen Air quality Brickfields parkrun 5 km Pollen Air quality Broadmeadow Linear parkrun 5 km Pollen Air quality Bushy parkrun, Dublin 5 km Pollen Air quality Cabinteely junior parkrun 2 km Pollen Air quality Carlow Town parkrun 5 km Pollen Air quality Cherry Orchard junior parkrun 2 km Pollen Air quality Con Smith parkrun 5 km Pollen Air quality Corkagh parkrun 5 km Pollen Air quality Darndale parkrun 5 km Pollen Air quality Deerpark Forest parkrun, Virginia 5 km Pollen Air quality Deerpark junior parkrun 2 km Pollen Air quality Deerpark parkrun, Carlanstown 5 km Pollen Air quality Dodder Valley parkrun 5 km Pollen Air quality Dundalk IT junior parkrun 2 km Pollen Air quality Fairview parkrun 5 km Pollen Air quality Griffeen junior parkrun 2 km Pollen Air quality Griffeen parkrun 5 km Pollen Air quality Hartstown parkrun 5 km Pollen Air quality Heritage Park junior parkrun 2 km Pollen Air quality Iveagh Sports Ground junior parkrun 2 km Pollen Air quality Laytown Beach parkrun 5 km Pollen Air quality Longford junior parkrun 2 km Pollen Air quality Longford parkrun 5 km Pollen Air quality Lough Key junior parkrun 2 km Pollen Air quality Lough Key parkrun 5 km Pollen Air quality Lusk Sports Hub junior parkrun 2 km Pollen Air quality Malahide Castle junior parkrun 2 km Pollen Air quality Malahide parkrun 5 km Pollen Air quality Marlay junior parkrun 2 km Pollen Air quality Mellowes Park junior parkrun 2 km Pollen Air quality Mountlucas parkrun 5 km Pollen Air quality Naas parkrun 5 km Pollen Air quality Navan parkrun 5 km Pollen Air quality Newbridge House junior parkrun 2 km Pollen Air quality Oldbridge parkrun 5 km Pollen Air quality Poolbeg parkrun 5 km Pollen Air quality Poppintree parkrun 5 km Pollen Air quality River Valley junior parkrun 2 km Pollen Air quality River Valley parkrun 5 km Pollen Air quality Rockfield junior parkrun 2 km Pollen Air quality Royal Canal parkrun, Kilcock 5 km Pollen Air quality Russborough parkrun 5 km Pollen Air quality Shanganagh parkrun 5 km Pollen Air quality Sport Ireland Campus parkrun 5 km Pollen Air quality St Anne’s junior parkrun 2 km Pollen Air quality St Anne’s parkrun 5 km Pollen Air quality The Old Rail Trail junior parkrun 2 km Pollen Air quality Tolka Valley parkrun 5 km Pollen Air quality Tullow parkrun 5 km Pollen Air quality Tymon parkrun 5 km Pollen Air quality Vicarstown junior parkrun 2 km Pollen Air quality Vicarstown parkrun 5 km Pollen Air quality Waterstown parkrun 5 km Pollen Air quality Wexford Racecourse parkrun 5 km Pollen Air quality Dublin Marathon 42 km Pollen Air quality

Get More in Our App

Local pollen and air quality forecasts, interactive pollen maps and route profiles

Download on the App Store Get it on Google Play

Features and forecast availability vary by region.
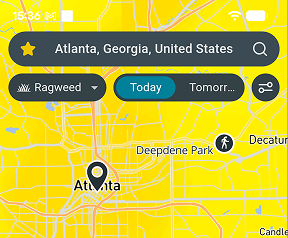
Airmine app pollen map

Air Quality

Today - 10 October

Pollutant Level Value
AQI
Good
19.2/100
PM2.5 (fine particles)
Good
13.0/100
PM10 (coarse particles)
Good
9.8/100
NO2 (nitrogen dioxide)
Good
9.5/100
O3 (ozone)
Good
19.2/100
SO2 (sulfur dioxide)
Good
1.1/100
CO (carbon monoxide)
Good
0.5/100
HCHO (formaldehyde)
Good
2.1/100
PM1 (ultrafine particles)
Good
5.0/100

Tomorrow - 11 October

Pollutant Level Value
AQI
Good
19.2/100
PM2.5 (fine particles)
Good
19.2/100
PM10 (coarse particles)
Good
14.5/100
NO2 (nitrogen dioxide)
Good
16.0/100
O3 (ozone)
Good
19.2/100
SO2 (sulfur dioxide)
Good
1.4/100
CO (carbon monoxide)
Good
0.6/100
HCHO (formaldehyde)
Good
3.1/100
PM1 (ultrafine particles)
Good
17.7/100
ENVIRONMENT & ANALYSIS

Local Environmental Conditions

Around the center of Dublin, dense development means road traffic is the main local source of nitrogen dioxide and fine particles. Its position by the Irish Sea brings breezes that often clear pollutants away. Local sources include industry. On some days, pollution drifting in from farther away outweighs local sources.

Fine particle levels climb from December to March, as home heating and traffic combine with cold, still air averaging 7°C. February is usually the windiest month, averaging about 25 km/h, which helps keep the air clean. From one day to the next, still, dry weather allows pollution to accumulate, and wind or rain clears it out.

Get pollen & AQ on Strava

Follow your environmental exposure and performance with the free Airmine-Strava integration. See your pollen and air quality exposure for every Strava activity.

Resource Hub

Pollen forecasts for Dublin Mold forecasts for Dublin
Air quality forecast neighborhoods 16 neighborhoods
Sports venues in Dublin 2 sports venues
Popular Local Routes 10 routes
Local parkruns 63 parkruns
Albert College junior parkrun 2 km
Saturdays
Pollen Air quality
Arklow Duck Pond junior parkrun 2 km
Saturdays
Pollen Air quality
Avondale Forest parkrun 5 km
Saturdays
Pollen Air quality
Balbriggan junior parkrun 2 km
Saturdays
Pollen Air quality
Ballinamore Greenway parkrun 5 km
Saturdays
Pollen Air quality
Local events 1 event

Frequently Asked Questions About Air Quality in Dublin

Is air quality bad in Dublin right now?

On 10 October 2026, overall air quality in Dublin is good. AQI is the main air quality indicator at 19.2/100. Pollution peaks around 3:00 PM (O3: 19.2/100).

Will air quality be worse tomorrow in Dublin?

On 11 October 2026, air quality conditions in Dublin will be similar to today, with AQI forecast at good at 19.2/100. Pollution peaks around 11:00 AM (PM2.5: 19.2/100).

When is air pollution at its worst in Dublin?

Fine particle levels climb from December to March, as home heating and traffic combine with cold, still air averaging 7°C. February is usually the windiest month, averaging about 25 km/h, which helps keep the air clean. From one day to the next, still, dry weather allows pollution to accumulate, and wind or rain clears it out.

Are air quality levels in Dublin based on measurements or forecasts?

It is forecasts derived by downscaling forecasts provided by EU’s Copernicus Atmosphere Monitoring Service (CAMS) by taking into account local conditions such as traffic patterns. CAMS bases its forecast on satellite measurements of particles and chemical compounds in the atmosphere. Airmine’s services were developed with support from the European Space Agency (ESA)’s Business Applications and Space Solutions (BASS) team.

Why doesn’t the forecast always reflect wildfire impacts?

Airmine’s forecast uses CAMS (Copernicus Atmosphere Monitoring Service) as its background atmospheric model. While CAMS includes wildfire emissions, these are derived from satellite observations and are not available in real time. During rapidly evolving wildfire events, there may therefore be a delay before increased emissions are incorporated into the model. As a result, the forecast may temporarily underestimate PM₂.₅ and other pollutants associated with wildfire smoke.

During rapidly evolving wildfire events, CAMS may lag by approximately 1–2 days before increased wildfire emissions are fully represented, which can lead to temporary underestimation of PM₂.₅ concentrations in Airmine’s forecast.

Understanding the Scale

The 0–100 air quality scores represent risk levels, not direct air pollutant concentrations. Higher scores indicate higher risk.

Air Quality

Good
0-20 Low air quality risk. Air quality is expected to be good, with low levels of pollution.
Fair
20-40 Generally low air quality risk. Air quality is expected to be acceptable, with some pollution present.
Moderate
40-60 Moderate air quality risk. Air pollution is elevated and air quality may be less favorable.
Poor
60-80 High air quality risk. Air pollution is high and air quality is expected to be poor.
Very Poor
80-100 Very high air quality risk. Air pollution is very high and air quality is expected to be very poor.

Airmine’s atmospheric monitoring platform was developed with support from the European Space Agency (ESA)’s Business Applications and Space Solutions (BASS) team, using satellite and Earth observation technologies to improve emissions monitoring. This page provides the latest public air quality forecast for Dublin.

Data provided by Airmine — Last update: 10 October 2026 at 20:32 CEST (Data is updated four times daily.)

Methodology & Technology

Airmine combines satellite observations, weather forecasts and machine learning to forecast pollen, air quality and mold risk. For pollen, vegetation maps and weather data help predict season onset and exposure at 400 × 400 metre resolution. For air quality, we refine Copernicus CAMS forecasts using local factors such as roads, emissions and terrain. For routes, data is updated dynamically to provide accurate exposure metrics along the specific race corridor coordinates.

Our models are calibrated against millions of professional monitoring records and updated four times daily as new data becomes available.

Unless stated otherwise, this content is Airmine’s sole responsibility and has not been paid for by external organisations.

Disclaimer

The information provided is for environmental awareness only and does not constitute medical advice. Athletes with known respiratory conditions or severe allergies should consult their physician before participating in strenuous outdoor activities based on these forecasts.

Some text on this page may be generated or summarised using artificial intelligence (AI). Wherever possible, AI-generated content is enriched with Airmine's proprietary data to improve its accuracy and relevance. However, AI-generated content may still contain errors, omissions, or inaccuracies.